
By: John Allen
It is the last week of December, 2020, and I find myself in my office browsing old project notebooks and articles I have collected and written over the last 30 years. Each made a contribution to the evolution and growth of The New Science of Fixing Things becoming the most effective group of engineers in the field of product and process performance, and reliability engineering. We have helped clients solve tough problems in just about every country that has a factory or two. We have worked on problems you have read about in the newspaper, and many more that were not because of the confidential nature of our work. And we have done it with surprising speed and a beautiful level of simplicity.
One article that drew my interest was, A Funny Thing Happened on the Way to Inspection by Robert W. Traver and Cecil A. Blocker, published in 1971 in Tooling & Production Magazine.
Traver was a consultant at Rath & Strong when he wrote the article. I talked to Bob several times in the 1990’s, and liked him. He was open and enjoyed telling stories about his work.
Bob and his team were working at a company making 105mm howitzer shells for infantry support on multiple presses. The client claimed that wall thickness variation was out of spec. The wall thickness variation was out-of-spec is not a good description when it could be better described as all over hells-half-acre.
The measurement system used to control quality is most often not suitable for gaining insight into What is Happening.
Traver goes on to describe the problem and the scrap and waste, then describes what he called Variation Research and claims Rath & Strong as the developer. What Traver actually used was multi-vari created in the 1940’s by Len Seder while at Gillette Safety Razor in Boston. Len published Diagnosis with Diagrams in the early 1950’s in Industrial Quality Control, making a significant contribution to diagnosis and quality control while emphasizing the importance of the visual power of proper diagrams.
Multi-vari was and is a useful way for decomposing machine behavior graphically into what is often called the three families of variation; within part, part-to-part, and time-to-time (we will see later that this can be dramatically improved with a simple change.) The 1950’s was a start, and Rath & Strong a contributor and proponent, but unfortunately, the method has generally been inhibited by dogmatic application and lack of creativity, poor descriptions of its use and power, and the search for ways to shoehorn what is easily done with quadrille paper, a straight edge and a pencil into programs such as Minitab which makes a series of calculations and additions which complicate the inherent simplicity. Properly done, there is never a need for any mathematical calculations with multi-vari. Multi-vari is a tool for seeing. Many who attempt to teach it see it as a tool to integrate into a system of probabilistic analysis based on their desire to promote tools, tool boxes and certification and belts, rather than effective problem solving. When one integrates ANOVA and significance testing with multi-vari, he has not seen the power of Visual Explanations[1] and the Sparsity of Effects.[2]
There are three classes of people: Those who see. Those who see when they are shown. Those who do not see. ”
– Leonardo da Vinci
Too often, those who do not see are doing the teaching.
“What can be done with fewer is done in vain with more.”
The figure below is from Traver’s article. The New Science of Fixing Things would have looked at fewer parts, learned more, and been finished by 10AM!
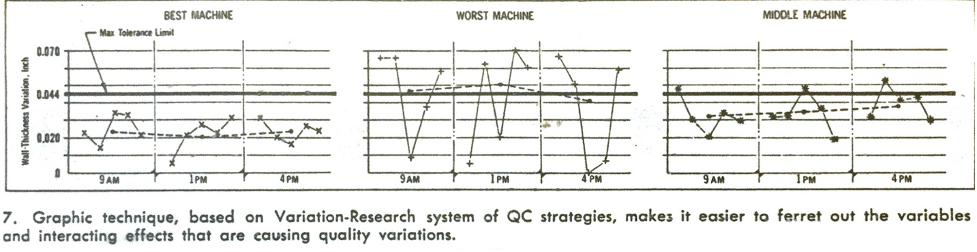
Traver, I think, was constrained by the conventional families of variation, within-piece, piece-piece, and time-time and felt the need to see them all for a complete diagnosis (even though his description of within-piece was flawed.) He also fell into the trap of using the measurement system the customer used for quality control, which failed to show the machine action as it creates the part, which is more often the case than not.
At 9AM, Traver plotted five single points on each of three machines to represent the variation in wall thickness in fifteen parts, then connected them to represent piece-piece. The axis represented within-piece variation, a mistake. Traver used a single value to represent the thickness variation. A single value misses over the machine action, which is more often than not, the key to insight and understanding; the Causal Explanation.
We seek a Causal Explanation, starting with effective questions to discover, “What’s Happening?” not “What’s Wrong?” A Causal Explanation provides a problem solver with the insight missing from a root cause or red x.
There is no indication as to how many locations on the wall were measured. There were clearly multiple readings, likely measured with a micrometer, then the smallest reading subtracted from the largest, thus claimed as wall thickness variation.
This is a common mistake, and we know it as soon as points are taken, but not plotted, and used for a mathematical operation. If points are measured, plot them but in a way to get a powerful and effective Visual Explanation of “What’s Happening?”.
The problem, I think, centers on a series of learned constraints, still taught today. First, is the definition of families of variation.
Within-part tells you to measure the part, but how? Dorian Shainin even claimed how important it is to, “Talk to the parts.” Well, that is sort of true.
How thick were the walls? What was the shape of the walls? What was the shape of the inside wall with respect to the outside wall? What would the wall look like if we measured position of the inside and outside wall at, say, 30 degree increments? What do you suppose we might learn if we looked across the part at 180° on three serial parts on just one machine with respect to the press die? Or the press and the sawn slug while orienting the slug with respect to the saw that cut off the slug?

Think about what Traver missed. The graphic above is the measurement of a cylinder created in a turning operation. 0° is the reference with respect to how the part was located in the turning machine. Each point is the radial distance from the axis of rotation, the geometric form created by the machine, progressing in the order created by the machine. There are nine radial measurements for each of three progressive circles, defined by the direction of the cutter feed.
Change the question to, “What’s Happening?”
In Travers example, he measured thickness, which has nothing at all to do with how the machine operates, how the part is located, or the travel of the cutter. Machine performance is what we care about. Capture it.
Asking “What’s Happening?” is how we start each project. Therefore, we don’t have to ask the questions above. We GET those answers, by changing the starting question from, “What’s Wrong” to “What’s Happening?”
If we want to characterize shape with respect to the machine, which only requires a prick punch or a marker pen when placing the slug into the press, and plot it properly, this would be simple.
Even better would be to have two marks, one for the slug position as it was cut from the bar, retaining orientation with respect to the saw, and a second mark, the angular position when placed into the press.
There is no reference in Travers article or plot to show the orientation of the parts with respect to the machines that created them. To get the idea, think of how a soda can is made. A round, thin flat aluminum slug is placed under a die, then punched into a can by a high speed die. Now just imagine it being scaled up to artillery shells, and you have the idea. However, in this case, the slugs were not punched from a sheet, but rather sawn from bar stock.
By locating and indexing these two marks which show orientation with respect to the saw and the press, and plotting shape (never thickness) with respect to the marks, the clever problem solver can quickly figure out if the principle source of variation is in the INPUT (sawn slugs) or FUNCTION (everything downstream of the saw.)
Characterizing machine behavior requires measuring parts, but shape must be measured, while capturing orientation with respect to the machine that produced it. This give you the ability to polt and view shape with respect to the datum scheme of the machine, and creating a Visual Explanation of the machine action.
Within-piece, piece-piece and time-time were defined in 1950 by Seder at Gillette in Boston. Traver and the Rath & Strong team, led by Dorian Shainin were all from the Boston area and picked up on it. Keki Bhote wrote about it in his book, World Class Quality, once Dorian Shainin showed it to him, making no contribution other than to carry on about its revolutionary importance. At The New Science of Fixing Things, we do not use the three conventional families.
When we make measurements of parts, we capture the elements of sub-cycles, cycles, and super-cycles that the machine undertakes. This simple change integrates the machine-part interface into the shape measurements and diagram, assuring visualization of the machine action as the part is created.

The graphic of the rotor above shows the power of small multiples so clearly, it requires little explanation.
However, perhaps I can provide a bit of additional insight:
- The vertical axis is deviation from the nominal. That means, the dial indicator was zeroed against a datumed gage block, then positioned against the part, retaining position. This is required in order to capture shape, not runout.
- The color code on the rotor matches the colors on the diagram.
- The specifications are left off. We are interested in characterizing the part-process interface, not if we should sell or scrap parts.
- There are no horizontal lines across the part, and there is no dotted line calculating from the center of each set of points. If you have figured out what matters, plot it without chartjunk.[5] Clean up your graphics!
Have a look at the vertical axis. It is deviation from the nominal. That means the dial indicator was not pushed against the rotor, then zeroed, which would only give you runout. The rotor was zeroed on a datumed gage block, then moved to the part so as to measure shape.
“Data displays must be clear, assured, reliable, sturdy. In designing information, then, the idea is to use just noticeable differences, visual elements that make clear difference, but no more-contrasts that are definite, effective and minimal.” Edward R. Tufte
There is one more key. Multi-vari is not used by The New Science of Fixing Things as a standalone strategy.
Multi-vari, when properly used, is as a subset of Small Multiples. Small multiples, popularized by Edward Tufte, provides more graphical choices and visual displays than multi-vari.
A small multiple is a series of graphs or charts using the same scale and axis, allowing them to be easily compared. The graphs or charts use the same scale and axes, allowing them to be easily compared. It uses multiple views to show different partitions of a dataset, capturing shape and orientation.
In problem solving, the most effective approach is to go out and get information on what’s really happening at the machine. Problems that seem complex can always be broken down, and this information will quickly reveal what needs fixing. Small multiples provides the best way of seeing what’s happening. It’s no more work than a process capability, just requires a bit more thought, but the information gained is infinitely more useful.
John Allen
Naples, Florida
The New Science of Fixing Things is located in North America (+1 603 969 0563) and Europe (+44 797 072 0437) and available to help you solve your chronic quality, product and process performance and reliability problems.
Diagnosing Performance and Reliability written by David J. Hartshorne, The New Science of Fixing Things, is the most powerful description of effective problem solving ever written with an excellent section on Small Multiples and multi-vari with examples and graphics, available at www.tnsft-bookstore.com
[1] Visual Explanations, Edward R. Tufte 1997
[2] Diagnosing Performance and Reliability, David J. Hartshorne 2019
Sparsity of Effects, John Allen https://fyx-z.com/2020/01/08/the-essence-of-strategy/
[3] Diagnosing Performance and Reliability, David J. Hartshorne, 2019 Page 116
[4] Diagnosing Performance and Reliability, David J. Hartshorne, 2019 P. 118
[5] Visual Explanations Edward Tufte 1977 pp 65,74
